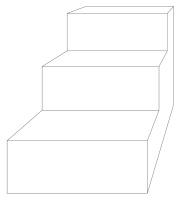
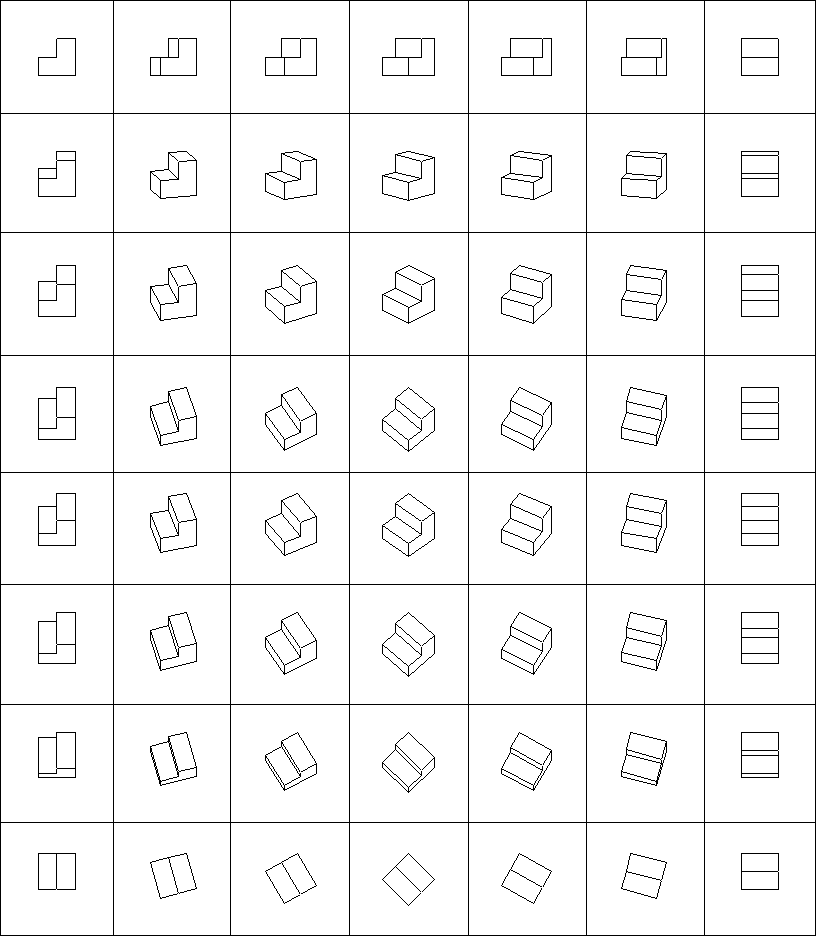
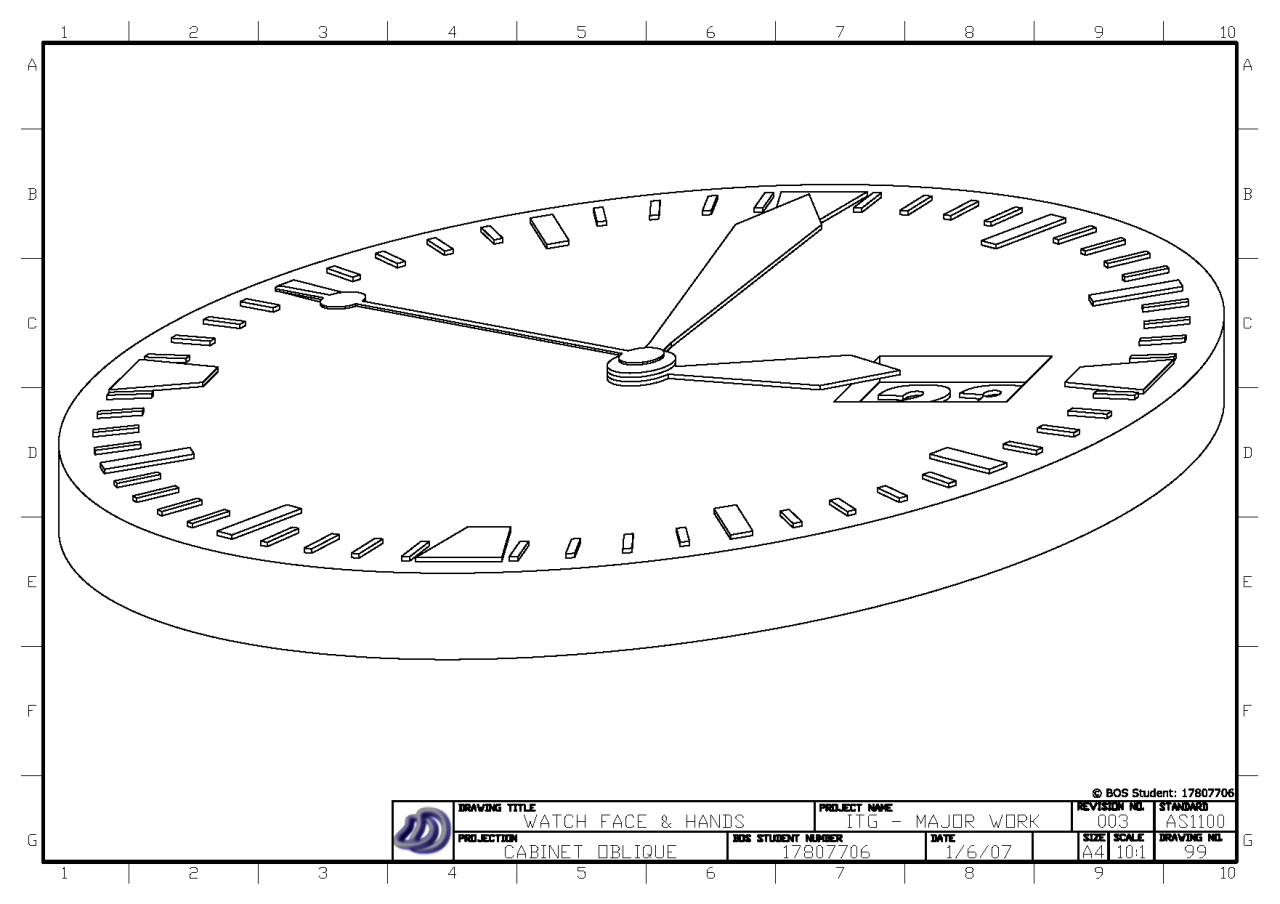
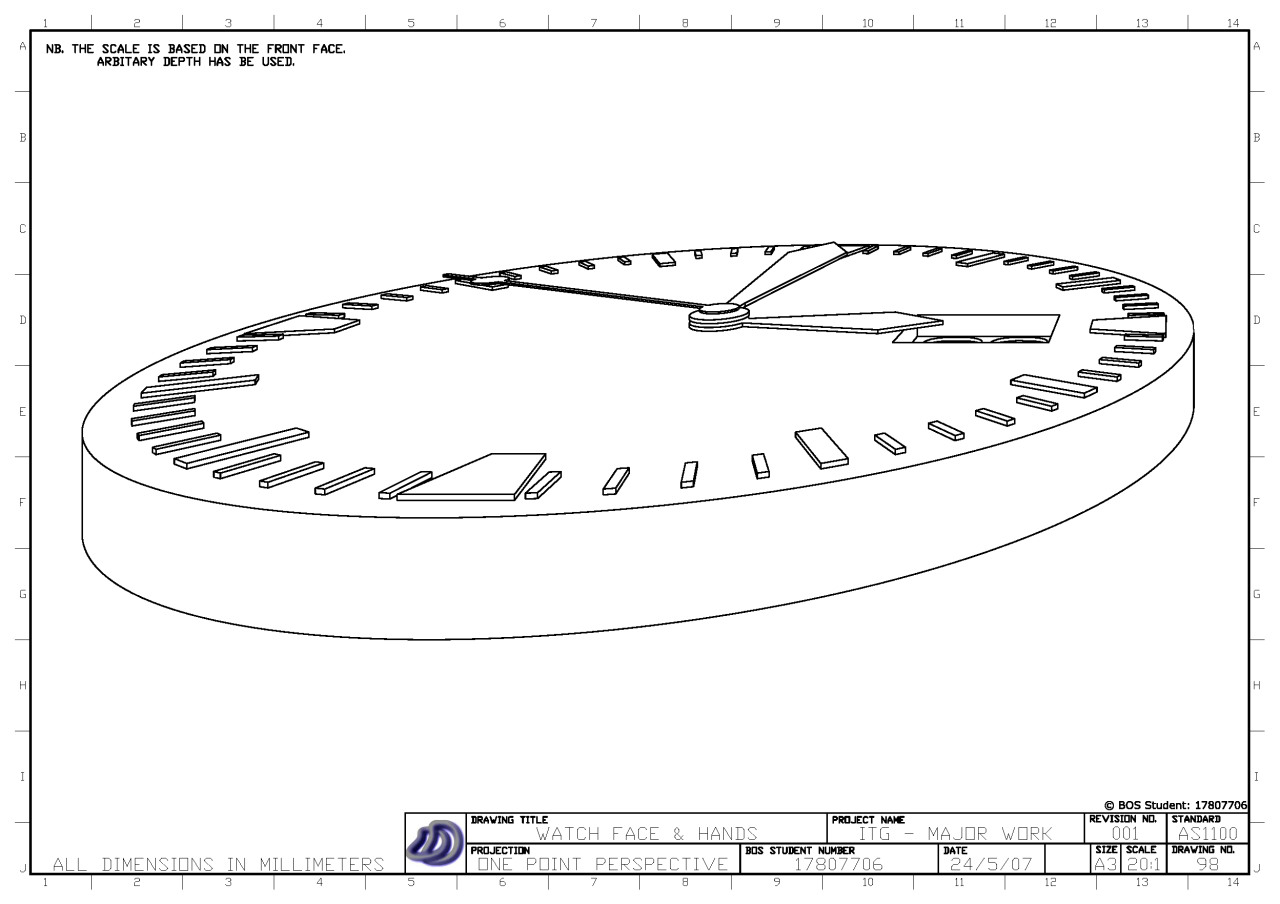
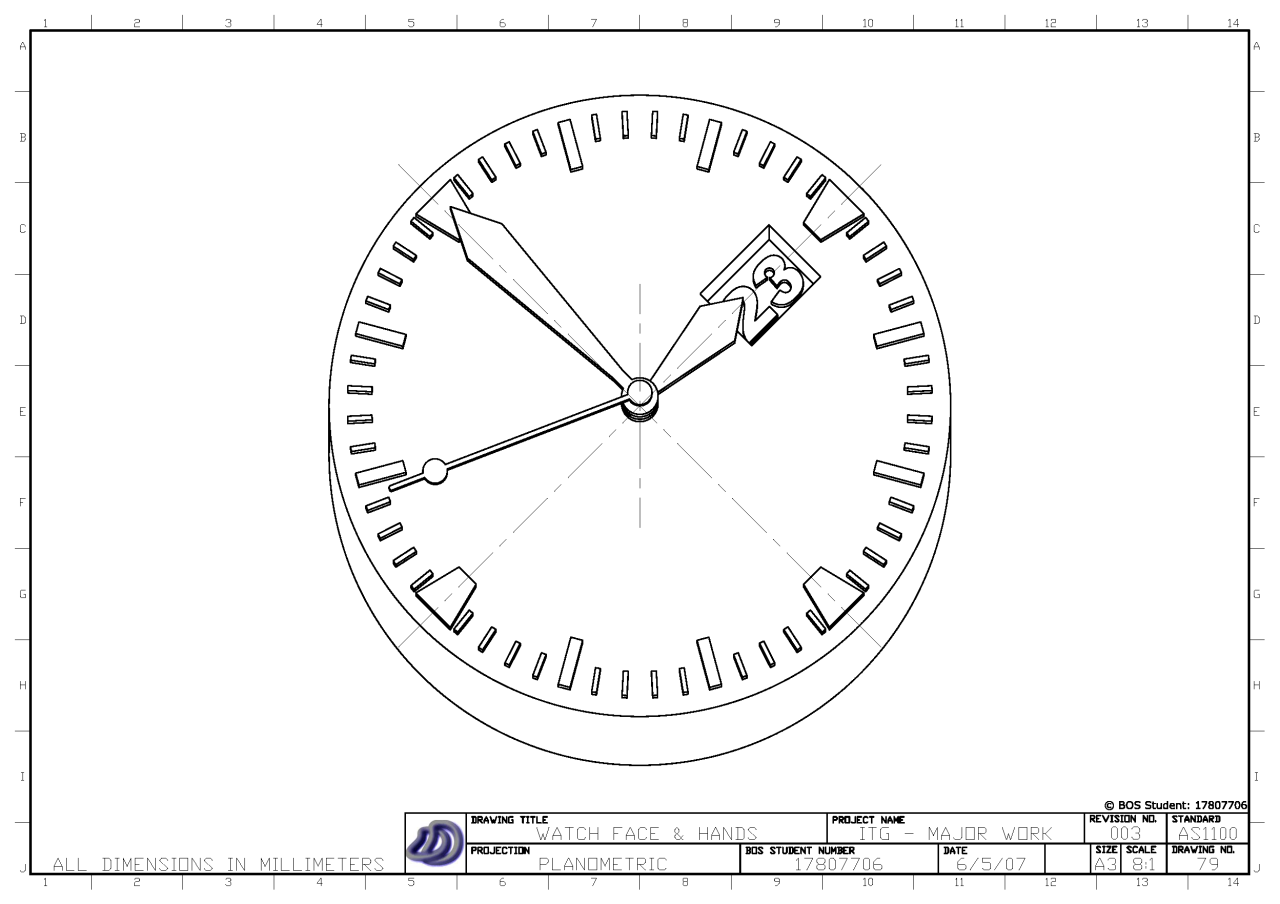
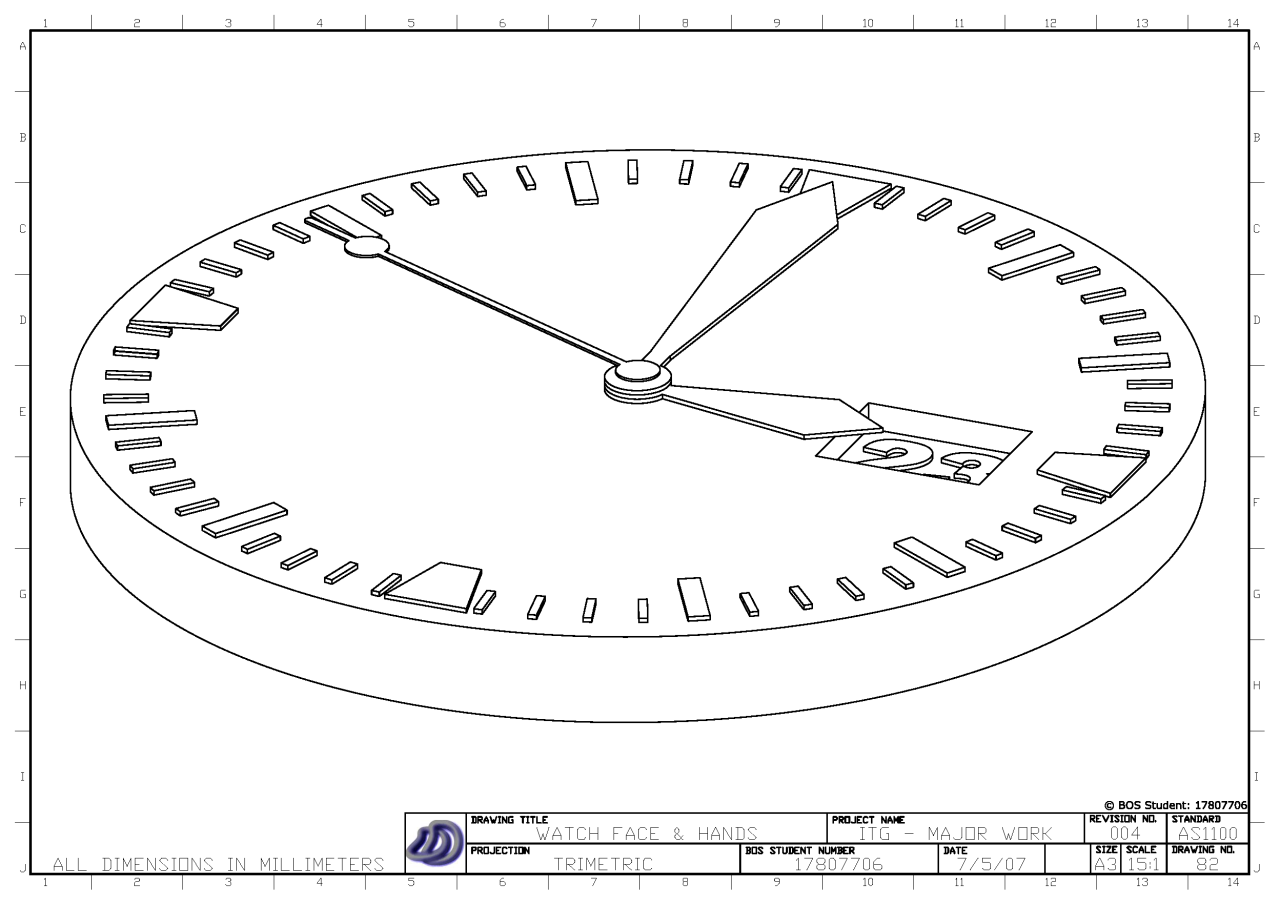
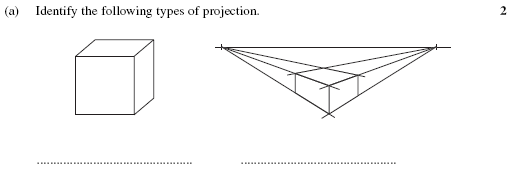
In the field of technical drawing, projection methods such as isometric, orthogonal, perspective are used to project three dimensional objects onto a two dimensional plane so that three dimensional objects can be viewed on paper or a computer screen. In this article I examine the different methods of projection and their mathematical roots (in an applied sense).
The approach that seems to be used by Technical Drawing syllabuses in NSW to draw simple 3D objects in 2D is almost entirely graphical. I don't think you can say this is a bad thing because you don't always want or need to know the mathematics behind the process, you just want to be able to draw without thinking about this. However to have an appreciation of what's really happening the mathematical understanding is a great thing to learn.
Many 3D CAD/CAM packages available on the market today (such as AutoCAD, Inventor, Solidworks, CATIA, Rhinoceros) can generate isometric, three point perspective or orthogonal drawings from 3D geometry, however from what I've seen they can't seem do other projections such as dimetric, trimetric, oblique, planometric, one and two point perspective. Admittedly I don't think these projections are any use or even needed, but when your at high school and you have to show that you know how do to oblique, et al. it can be a problem when the software cannot do it for you from your 3D model. (So I actually wrote a small piece of software to help with this in this article). But to do so, I needed to understand the mathematics behind these graphical projections. So I will try to explain that here.
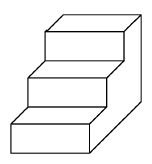
The key idea is to think of everything having coordinates in a coordinate system (I will use the Cartesian system for simplicity). We can then express all these projections as mathematical transformations or maps. Like a function, you feed in the 3D point, and then you get out the projected 2D point. Things get a bit arbitrary here because an isometric view is essentially exactly the same as a front view. So we keep to the convention that when we assign the axis of the coordinate system we try to keep the three planes of the axis parallel to the three main planes of the object.
[caption id="attachment_107" align="aligncenter" width="450" caption="The three "main" planes of the object are placed parallel to the three planes of the axis. This is how we will choose our axis in relation to the object."]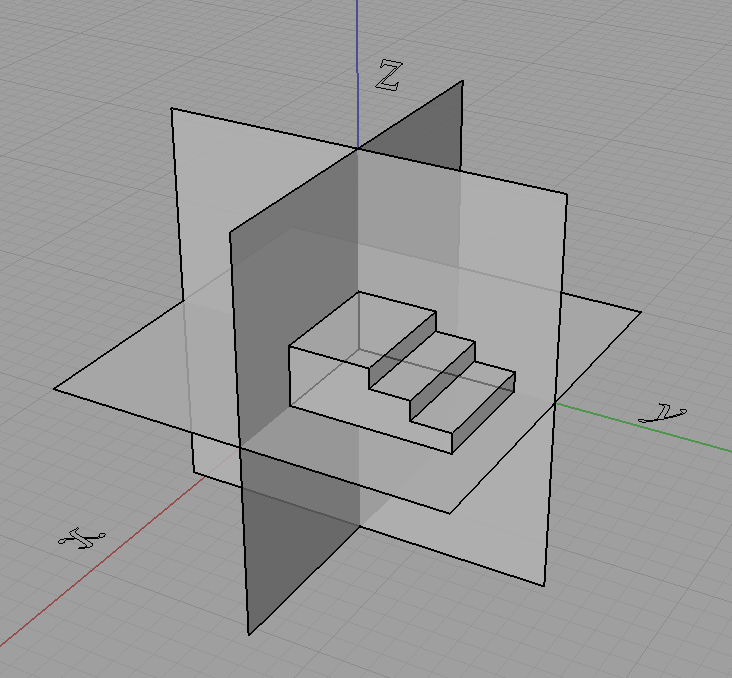 [/caption]
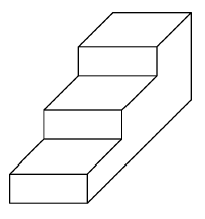
We will not do this though,
[caption id="attachment_108" align="aligncenter" width="450" caption="We will not choose it like this..."]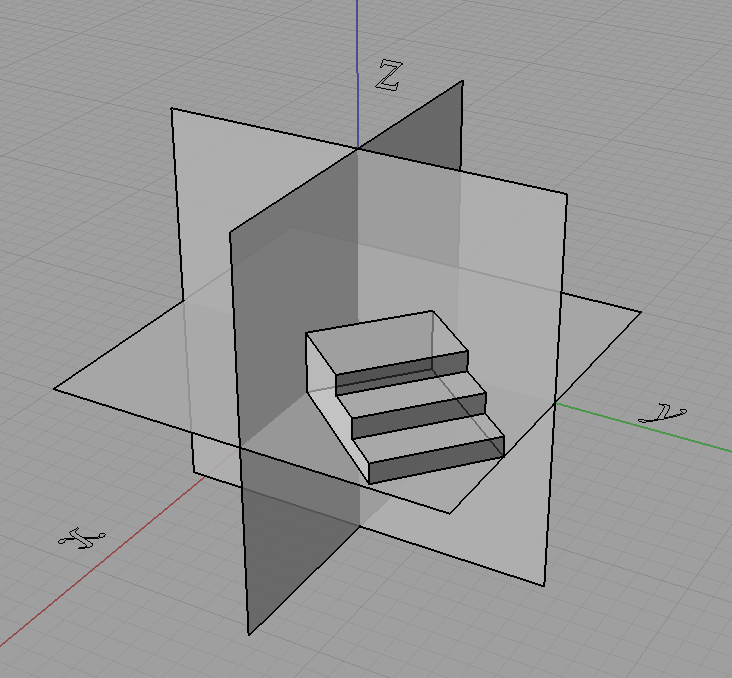 [/caption]
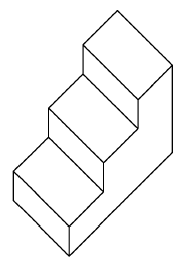
[caption id="attachment_109" align="aligncenter" width="450" caption="...or this."]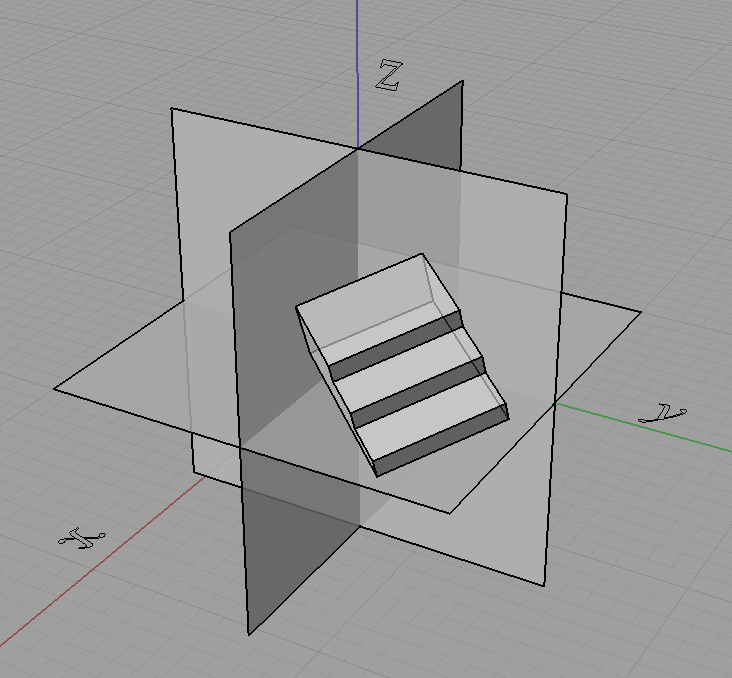 [/caption]
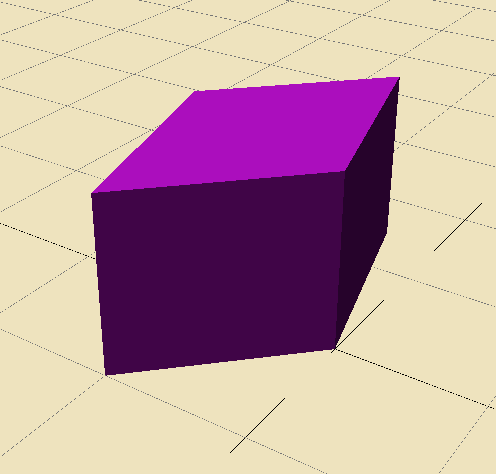
In fact doing something like that shown just above with the object rotated is how we get projections like isometric.
Now what we do is take the coordinates of each point and "transform" them to get the projected coordinates, and join these points with lines where they originally were. However we can only do this for some kinds of projections, indeed for all the ones I have mentioned in this post this will do but only because these projections have a special property. They are linear maps (affine maps also hold this property and are a superset of the set of linear maps) which means that straight lines in 3D project to straight lines in 2D.
For curves we can just project a lot of points on the curve (subdivide it) and then join them up after they are projected. It all depends what our purpose is and if we are applying it practically. We can generate equations of the projected curves if we know the equation of the original curve but it won't always be as simple. For example circles in 3D under isometric projection become ellipses on the projection plane.
Going back to the process of the projection, we can use matrices to represent these projections where
$latex \begin{pmatrix}x'\\ y'\\ z'\end{pmatrix} = \begin{pmatrix}a&b&c\\ d&e&f\\ g&h&i\end{pmatrix}\begin{pmatrix}x\\ y\\ z\end{pmatrix}$
is the same as,
$latex x' = ax+by+cz\\ y' = dx+ey+fz\\ z' = gx+hy+iz.$
We call the 3 by 3 matrix above as the matrix of the projection.
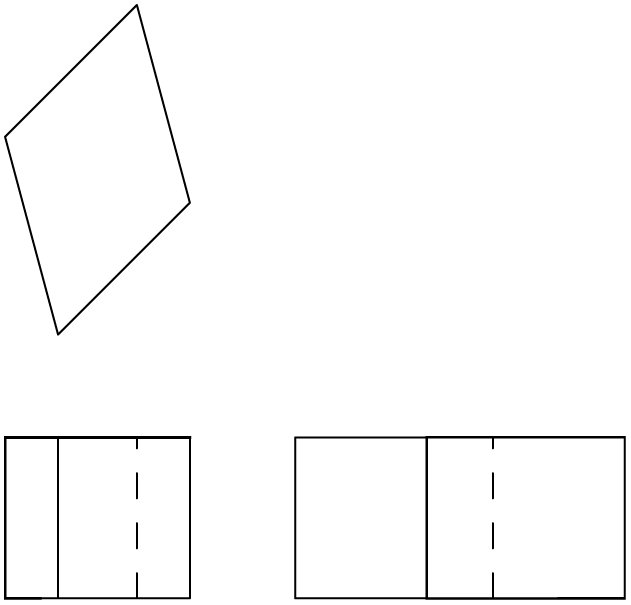
Knowing all this, we can easily define orthogonal projection as you just take two of the dimensions and cull the third. So for say an orthographic top view the projection matrix is simply,
$latex \begin{pmatrix}1&0&0\\ 0&1&0\\ 0&0&0\end{pmatrix}.$
Now we want a projection matrix for isometric. One way would be to do the appropriate rotations on the object then do an orthographic projection, we can get the projection matrix by multiplying the matrices for the rotations and orthographic projection together. However I will not detail that here. Instead I will show you another method that I used to describe most of the projections that I learnt from high school (almost all except perspectives).
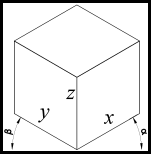
I can describe them as well as many "custom" projections in terms of what the three projected axis look like on the projection plane. I described them all in terms of a scale on each of the three axis, as well as the angle two of the axis make with the projection plane's horizontal.
[caption id="attachment_112" align="aligncenter" width="151" caption="Projection attributes described in terms of the projected axis."]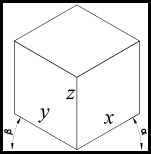 [/caption]
Using this approach we can think of the problem back in a graphical perspective of what the final projected drawing will look like rather than looking at the mathematics of how the object gets rotated prior to taking an orthographic projection or what angle do the projection lines need to be at in relation to the projection plane to get oblique, etc. Note also that the x, y, z in the above diagram are the scales of the x, y, z axis respectively. So we can see in the table below that we can now describe these projections in terms of a graphical approach that I was first taught.
| Projection |
α (alpha) |
β (beta) |
Sx |
Sy |
Sz |
| Isometric |
30° |
30° |
1 |
1 |
1 |
| Cabinet Oblique |
45° |
0° |
0.5 |
1 |
1 |
| Cavalier Oblique |
45° |
0° |
1 |
1 |
1 |
| Planometric |
45° |
45° |
1 |
1 |
1 |
Now all we need is a projection matrix that takes in alpha, beta and the three axes scale's and does the correct transformation to give the projection. The matrix is,
$latex \begin{bmatrix}x'\\y'\\z'\\1\end{bmatrix}=\begin{bmatrix}S_x\cos\alpha&-S_y\cos\beta&0&0\\ S_x\sin\alpha&S_y\sin\beta&S_z&0\\ 0&0&0&0\\ 0&0&0&1\end{bmatrix}\begin{bmatrix}x\\y\\z\\1\end{bmatrix}$
Now for the derivation. First we pick a 3D Cartesian coordinate system to work with. I choose the Z-up Left Hand Coordinate System, shown below and we imagine a rectangular prism in the 3D coordinate system.
[caption id="attachment_114" align="aligncenter" width="450" caption="Block in 3D coordinate system."]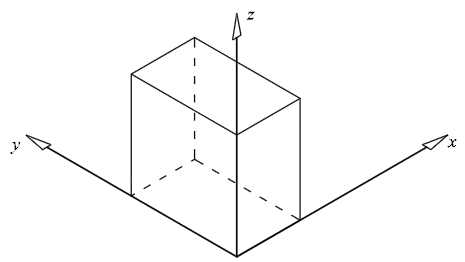 [/caption]
Now we imagine what it would look like in a 2D coordinate system using isometric projection.
[caption id="attachment_115" align="aligncenter" width="450" caption="Block in 2D coordinate system (isometric)."]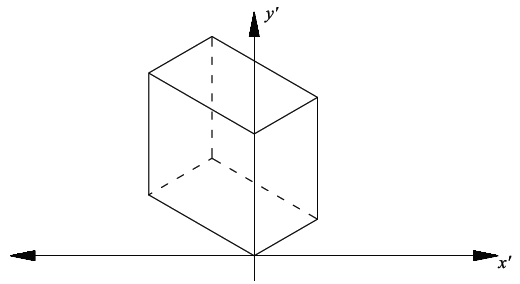 [/caption]
As the alpha and beta angles (shown below) can change, and therefore not limited to a specific projection, we need to use alpha and beta in the derivation.

Now using these simple trig equations below we can deduce the following.

All the points on the xz plane have y = 0. Therefore the x’ and y’ values on the 2D plane will follow the trig property shown above, so:
$latex x'=x\cos\alpha$
$latex y' = z + y\sin\alpha$
However not all the points lie on the xz plane, y is not always equal to zero. By visualising a point with a fixed x and z value but growing larger in y value, its x’ will become lower, and y’ will become larger. The extent of the x’ and y’ growth can again be expressed with the trig property shown, and this value can be added in the respective sense to obtain the final combined x’ and y’ (separately).
$latex x'=x\cos\alpha -y\cos\beta$
$latex y' = z + x \sin \alpha + y \sin \beta$
If y is in the negative direction then the sign will automatically change accordingly. The next step is to incorporate the scaling of the axes. This was done by replacing the x, y & z with a the scale factor as a multiple of the x, y & z. Hence,
$latex x'=S_x x\cos\alpha -S_y y\cos\beta$
$latex y' = S_z z + S_x x\sin\alpha + S_y y \sin \beta$
This can now easily be transferred into matrix form as shown at the start of this derivation or left as is.
References:
Harvey, A. (2007). Industrial Technology - Graphics Industries 2007
HSC Major Project Management Folio. (Link)
 [/caption]
 [/caption]
 [/caption]